Create a Custom Google Data Studio Connector for Facebook Ads
by Bayne Brannen
Summary
I use the Facebook Graph API and Google Apps Script to build a custom Data Connector for Google Data Studio.
- Google Apps Script
- Facebook API
- Google Data Studio
As I've mentioned before, a lot of my love of data comes from figuring out how to get it from one place to another. I currently work in marketing and have been looking for an easy way to show our Google and Facebook ads side-by-side without any manual data transformation. Google Data Studio is a great solution here. However, there is no proprietary way to bring Facebook Ads data into Google Data Studio. You can purchase a Community Connector, but who wants to spend that extra money when you could just import it yourself? So here's my solution for a quick and easy Data Connector for Facebook Ads.
I'll begin by saying this is sort of a bootstrap solution. If I was selling this or putting this connector out into the community, I would definitely add an authentication section. I was planning on releasing it for free to the community so you could more easily plug and play, however, using the authentication would require me to set up a server that would cache this authentication and unfortunately that's not in my personal budget. But I'm imagining you're here because you want a solution that you can customize anyway. So I've built the bones, and then you can take the wheel. Rest assured, this code will allow you to import your Facebook Ads data into Google Data Studio. For the broader strokes, I will describe what I'm doing in paragraph form, smaller points will be included in the comments of the code. That being said, I'm not going to walk you through how to set up a new Google Apps Script environment or how to get a Facebook API access token. That information is freely available elsewhere, but if you really want help you can email me at baynebrannen@gmail.com.
Anyway, that's enough flagging! Let's get started with this project. Now, the structure of this will be straight out of the Community Connector documentation from Google Data Studio. The application has a specific way it calls functions and sends and accepts data. So first of all, we'll just initialize this project as a connector project.
var cc = DataStudioApp.createCommunityConnector();That was easy! Okay, next we're going to tell Google Ad Studio that we don't really need to use authentication. Again, if we were selling this or putting this on their store we would, but because it is being kept private, we can just add in the access token manually. I cannot emphasize enough how much you should ensure that this token (and by extension this completed code) is not shared with anyone or made public.
function getAuthType() {
  var AuthTypes = cc.AuthType;
  return cc
    .newAuthTypeResponse()
    .setAuthType(AuthTypes.NONE)
    .build();
}
Hey, that was also easy! Don't worry—we'll start to do some customization now. The next function getConfig() allows us to build the configuration for the data source. This could provide nearly any variable that will affect the pool of data that Data Studio will pull. In this case, I want to provide a timeframe for the data. We'll get to the Facebook API later, but for now, just know that we can provide pre-defined date ranges using various strings that will affect how much data will be pulled. For instance, "last_30d" will only pull data from—you guessed it—the last 30 days. So in the getConfig() function, we will define these options and how the user will select them using several properties inherent to the config object (a class created by the Data Studio team). I give the configuration an id with setId so we know how to reference it later, I give it a descriptive user-facing name with setName, I setHelpText so the user knows what the configuration is doing, setAllowOverride just allows report editiors to modify the default values, and then for each option we set the label that the user will see with setLabel and the actual value that our code will use with setValue.
function getConfig() {
  var config = cc.getConfig();
  config.setDateRangeRequired(true);
  config
    .newSelectSingle()
    .setId('date_config')
    .setName('Select date preset')
    .setHelpText('Select the date preset for which you would like to receive the ads data.')
    .setAllowOverride(true)
    .addOption(config.newOptionBuilder().setLabel('Today').setValue('today'))
    .addOption(config.newOptionBuilder().setLabel('Yesterday').setValue('yesterday'))
    .addOption(config.newOptionBuilder().setLabel('This week (Sunday to today)').setValue('this_week_sun_today'))
    .addOption(config.newOptionBuilder().setLabel('Last week (Sunday to Saturday)').setValue('last_week_sun_sat'))
    .addOption(config.newOptionBuilder().setLabel('Last week (Monday to Sunday)').setValue('last_week_mon_sun'))
    .addOption(config.newOptionBuilder().setLabel('This month').setValue('this_month'))
    .addOption(config.newOptionBuilder().setLabel('Last month').setValue('last_month'))
    .addOption(config.newOptionBuilder().setLabel('This quarter').setValue('this_quarter'))
    .addOption(config.newOptionBuilder().setLabel('Last three days').setValue('last_3d'))
    .addOption(config.newOptionBuilder().setLabel('Last seven days').setValue('last_7d'))
    .addOption(config.newOptionBuilder().setLabel('Last 28 days').setValue('last_28d'))
    .addOption(config.newOptionBuilder().setLabel('Last 30 days').setValue('last_30d'))
    .addOption(config.newOptionBuilder().setLabel('Last 90 days').setValue('last_90d'))
    .addOption(config.newOptionBuilder().setLabel('This year').setValue('this_year'))
    .addOption(config.newOptionBuilder().setLabel('Last year').setValue('last_year'))
    .addOption(config.newOptionBuilder().setLabel('Maximum').setValue('maximum'))


  return config.build();
}
Next let's outline the data schema we'll be working with. Google Data Studio needs to know what types of data we're importing so it knows how to handle and format it. That is what we are doing here. I have seen in advance what fields we'll be pulling about our Facebook ads, and looked through the documentation to see what category of data each data point falls into. Besides the customization of the data points this is straight out of the documentation.
function getFields() {
  var cc = DataStudioApp.createCommunityConnector();
  var fields = cc.getFields();
  var types = cc.FieldType;
  var aggregations = cc.AggregationType;

  fields.newDimension()
    .setId('ad_id')
    .setName('Ad ID')
    .setType(types.TEXT);

  fields.newMetric()
    .setId('cost_per_unique_click')
    .setName('Cost per Unique Click')
    .setType(types.NUMBER);

  fields.newMetric()
    .setId('cpp')
    .setName('Cost per Pixel')
    .setType(types.NUMBER);

  fields.newDimension()
    .setId('date_stop')
    .setName('Date Stop')
    .setType(types.YEAR_MONTH_DAY);

  fields.newMetric()
    .setId('cpm')
    .setName('Cost per 1K Impressions')
    .setType(types.NUMBER);

  fields.newDimension()
    .setId('adset_id')
    .setName('Adset ID')
    .setType(types.TEXT);

  fields.newDimension()
    .setId('adset_name')
    .setName('Adset Name')
    .setType(types.TEXT);

  fields.newDimension()
    .setId('account_id')
    .setName('Account ID')
    .setType(types.TEXT);

  fields.newDimension()
    .setId('campaign_id')
    .setName('Campaign ID')
    .setType(types.TEXT);

  fields.newDimension()
    .setId('campaign_name')
    .setName('Campaign Name')
    .setType(types.TEXT);

  fields.newDimension()
    .setId('date_start')
    .setName('Date Start')
    .setType(types.YEAR_MONTH_DAY)

  fields.newDimension()
    .setId('ad_name')
    .setName('Ad Name')
    .setType(types.TEXT);

  fields.newMetric()
    .setId('clicks')
    .setName('Clicks')
    .setType(types.NUMBER);

  fields.newMetric()
    .setId('ctr')
    .setName('CTR')
    .setType(types.NUMBER);

  fields.newMetric()
    .setId('cpc')
    .setName('CPC')
    .setType(types.NUMBER);

  fields.newMetric()
    .setId('impressions')
    .setName('Impressions')
    .setType(types.NUMBER);

  fields.newMetric()
    .setId('spend')
    .setName('Spend')
    .setType(types.NUMBER);

  fields.newMetric()
    .setId('reach')
    .setName('Reach')
    .setType(types.NUMBER);

  return fields;
}
This function will just get the schema and format it properly for Google Data Studio's digestion. Again—straight out of the documentation.
function getSchema() {
  var fields = getFields().build();
  return {schema:fields};
}
Here's where we start to jump out of the documentation a bit. The next function Google Data Studio needs from us is getData() which does exactly what it says on the tin. But first we need to build the functions it's going to use to get that data. So now it's time to finally use the Facebook API.
First up, this function will pull all of the fields for Facebook Ads we want. This function takes entity_id which will be your Facebook ad account id. I have commented the code here to explain exactly what it is doing. It took a lot of searching to figure out how a nested query works for this API, but querying every ad id would have quickly put us over the rate limit for our access token. The nested query allows us to pull all several videos' insights data at once. You will put your access token where it says YOUR-ACCESS-TOKEN. But I will emphasize again please ensure that your access token is not available publically or shared with anyone. I will not be responsible for anyone's data leakage or Facebook ad account havoc!
function FBInsights(entity_id, date_config) {

// Here I would hardcode an access token to the Facebook API that has the correct permissions.
// You will put your own token here. But again:

// MAKE SURE YOU DO NOT SHARE THIS OR MAKE IT PUBLICALLY AVAILABLE

var access_token = 'YOUR-ACCESS-TOKEN';

// Now we'll start to build the url. We start with the basic Graph API url and then add the ad
// account id (here the entity_id variable).


var url = 'https://graph.facebook.com/v10.0/'
  + entity_id
  // Now we specify that it is ads data we are looking for.
  + '/ads'
  // And then we specify the fields of ad data we are looking for. Here we use a nested query—
  // we pull insights for the ads, and then we can specify additional fields within that query
  // by using the "." Here is where we add in the date_preset configuration that we set up
  // from the start. Additionally, note that we have to encode this part of the URI because it
  //  contains brackets and other symbols that URLs don't work well with.
  + '?fields=insights.'
  + encodeURIComponent('('
  + date_config
  + '){account_id,ad_id,ad_name,adset_id,adset_name,campaign_id,campaign_name,date_start,date_stop,impressions,clicks,conversions,cost_per_conversion,cost_per_unique_click,cpc,cpm,cpp,reach,ctr,spend}')
  // And then here at the end we'll add our access token so that Facebook knows we should have
  // access to this information.
  + '&access_token=' + access_token


// Now we fetch the response using the url we've generated above, get the data in JSON form,
// and then parse that data into Javascript/Google Apps Script objects.

var response = UrlFetchApp.fetch(url);
var json = response.getContentText();
var data = JSON.parse(json);

return data;
}
Like a lot of APIs, Facebook doesn't want us to pull all of our data at once. It uses pagination to throttle just how much data we can request so that we don't overload their servers. To cycle through the pages, I've created a function similar to the one above, but this time we don't need to create the url ourselves. The url for the next "page" of data is returned by the FB_insights function. So here, we just grab that url and then fetch and parse the data in the same way.
function FBInsights_next(next_page) {
  var url = next_page

  var response = UrlFetchApp.fetch(url);
  var json = response.getContentText();
  var data = JSON.parse(json);

  return data

}
The Get_ad_stats() function is essentially a handler function for the two above functions. It runs the FBInsights function to get the first page (providing the ad account ID) and then uses the FBInsights_next function to grab each subsequent page of data. Here is where you put your ad account id which will be a string of numbers preceded by "act_"
function Get_ad_stats(date_config) {

  // We retrieve the response from the first page of Facebook ads data.

  var first_page = (FBInsights('act_XXXXXXXXXXXXXX', date_config));

  // We then grab the url for the next page from that first page.

  var next_url = first_page['paging']['next'];

  // We also extract the data from that first page.

  var ad_stats = first_page['data'];

  // We are going to use a while loop, so that we cycling on to the next page until there are
  // no pages left. Thus, until "next_url" is null.

  while (next_url != null) {
    var new_pull = FBInsights_next(next_url)

    // Some of the ads do not have any data associated with them. Likely they were not built
    // out correctly or not executed. In any case, we don't care about them. So I've couched
    // this all in a try, catch. Most of the time it will look at the new page of data
    // ("new_pull") and then grab the data for the new ads as new_ads and the next page url
    // as next_url. Then it will concatenate the previous ad_stats with the data from new_ads.
    // By the end, all of our ad data will be concatenated into one data set.

    try {
      var new_ads = new_pull['data'];
      var next_url = new_pull['paging']['next'];
      var ad_stats = ad_stats.concat(new_ads)
    }
    catch(error) {
      Logger.log("Error: This ad has no insights.")
    }
  }
Now it is time for the getData function. Notably, this function takes "request" which is going to be the request for data that Google Data Studio will send this connector. It took me awhile to understand how this worked, but essentially: depending on the fields and values you want to include, Google Data Studio will send a request only for that data. So it's not enough to pull all of the data, you have to give the connector a way to make sure it's only giving the data that Google Data Studio is asking of it. This function is called repeatedly whenever you add or remove a field from your Data Studio chart.
function getData(request) {

  // Straight from the documentation, this loops through the fields of the request to find
  // all of the field names requested. The object created here will allow us to build the
  // data schema later.

  var requestedFields = getFields().forIds(
    request.fields.map(function(field) {
      return field.name;
    })
  );

  // This was my solution to keep the values in the same order as the schema (they have to be
  // or else Google Data Studio will get confused and assign the wrong values to certain
  // fields). I cycled through the requestedFields and created a list of all of them.

  var finalFields = []
  requestedFields.build().forEach(function(field) {
    finalFields.push(field.name)
  });

  // Prepare data schema for population

  var dataSchema = getSchema(request).schema;
  var data = [];

  // Fetch the date_preset date configuration to pass to the Facebook API

  date_config = request.configParams.date_config
  var content = Get_ad_stats(date_config)


  // Provides values in the order defined by the schema (the order comes from finalFields)

  content.forEach(function(row) {
    var values = [];
    finalFields.forEach(function(field) {
      switch(field) {

        case('ad_id'):
          values.push(row.ad_id)
          break;

        case('cost_per_unique_click'):
          values.push(row.cost_per_unique_click)
          break;

        case('cpp'):
          values.push(row.cpp)
          break;

        case('date_stop'):
          // Note that a regular expression is used here to get rid of all '-' in the dates to
          // provide the date data the way that Google Data Studio takes it
          // (as a single string, eg '20210618')
          values.push(row.date_stop.replace(/-/gi, ''))
          break;

        case('cpm'):
          values.push(row.cpm)
          break;

        case('adset_id'):
          values.push(row.adset_id)
          break;

        case('adset_name'):
          values.push(row.adset_name)
          break;

        case('account_id'):
          values.push(row.account_id)
          break;

        case('campaign_id'):
          values.push(row.campaign_id)
          break;

        case('campaign_name'):
          values.push(row.campaign_name)
          break;

        case('date_start'):
          values.push(row.date_start.replace(/-/gi, ''));
          break;

        case('ad_name'):
          values.push(row.ad_name)
          break;

        case('clicks'):
          values.push(row.clicks)
          break;

        case('ctr'):
          values.push(row.ctr)
          break;

        case ('cpc'):
          values.push(row.cpc)
          break;

        case('impressions'):
          values.push(row.impressions)
          break;

        case('spend'):
          values.push(row.spend)
          break;

        case('reach'):
          values.push(row.reach)
          break;
      }
    });

    // Now we push this row of values into the data list. This happens for each row of data
    // until all rows have been added.

    data.push({
      values: values
    });
  });


  // And then we return the schema which we build using a built-in method from Google Data
  // Studio and our requestedFields that we had created at the top of the getData() function;
  // as well as the all of the rows from our data object. This is the format Google Data
  // Studio takes the data, and from here you can just test it to make sure it works for you.

  return {
      schema: requestedFields.build(),
      rows: data
    };

}
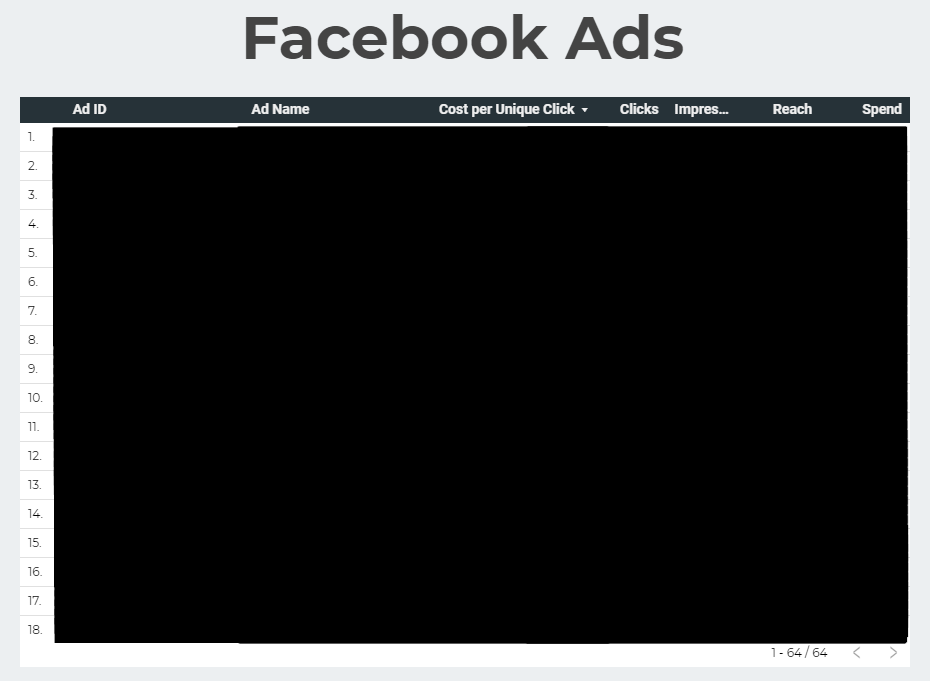
You will still have to deploy it to Google Data Connector, but those instructions will probably be clearer straight from the horses mouth. Here's the documentation for that process And then you can make a table like this—except your data won't be completely redacted!